Process maps use symbols to show the different aspects of a process, e.g. activities, decisions. There are several notation sets available, and this article describes BPMN, an internationally recognised and used standard.
In the examples of BPMN below, a fictitious Accident and Emergency case study will be used. As we develop the A&E process the diagrams will evolve with various elements being added or changed as we go along. Normally you try to map the complete picture from the start - the examples are not meant to show that, but to demonstrate the specific BPMN elements being described.
The main components of a BPMN process map are:
- Pools and Swim lanes
- Start / Finish / Intermediate Events
- Connectors
- Tasks
- Gateways
- Artefacts
Pools and Swim lanes
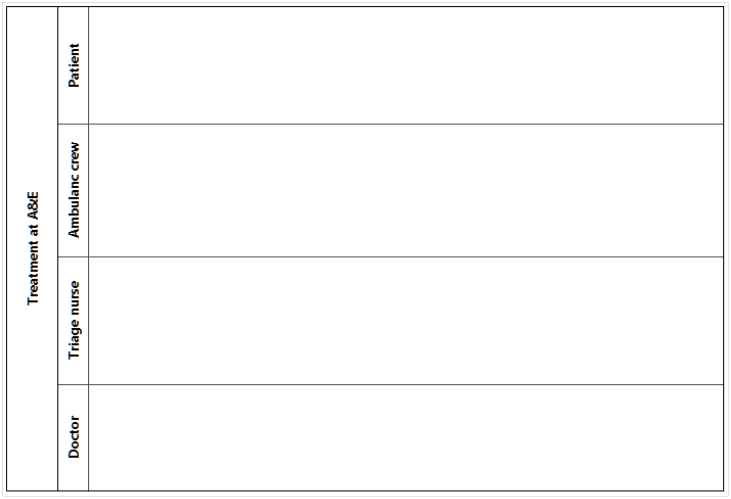
Each swim lane represents a particular actor / role (or swimmer). An actor is someone who fulfils a particular role, e.g. Finance Officer and HR Officer. Each lane is labelled at the left hand end (or top if vertical) with the name of the actor's role and the pool is named with the overall process that's being mapped. The example here shows the actors from the A&E case study (click to expand). Any symbols inside a swim lane represent activity that is carried out by that actor.
Start / Finish / Intermediate Events
All processes must have one start event - the thing that triggers the process happening, and at least one finish event (but there can be more than one). An intermediate event is something that happens in between the start and finish and there can be zero, one or more intermediate events in a process.Start events are shown by a circle with a thin circumference line, finish events are circles with a thick circumference line, and intermediate events are circles with a double thin circumference line. The circles can be empty to denote generic events, or filled with special symbols to denote certain types of event such as messages, errors, etc.. For this article only generic events will be used.
The example here shows a very simple process with a start and a finish - in practice this would never happen (click to expand).
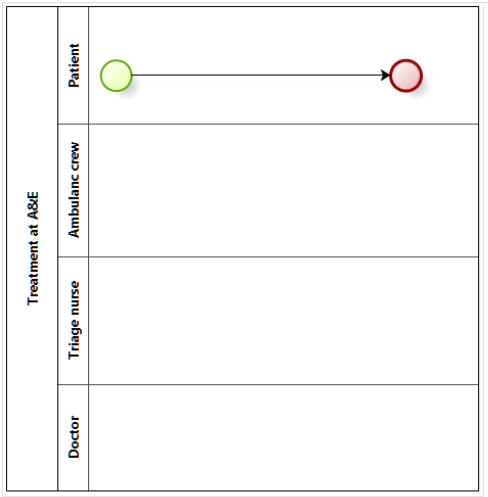
Note that the start event has a green fill and the finish event has red fill - this is just to make the symbols easier to distinguish and a bit more interesting to look at: it is not part of BPMN to colour-code symbols. The BizAgi Process Modeler application used for these models provides these colour fills automatically, and colour fills can be switched off in BizAgi if desired.
The symbols in the example are not labelled, but note that it is good practice to label symbols unless it is really obvious what they mean.
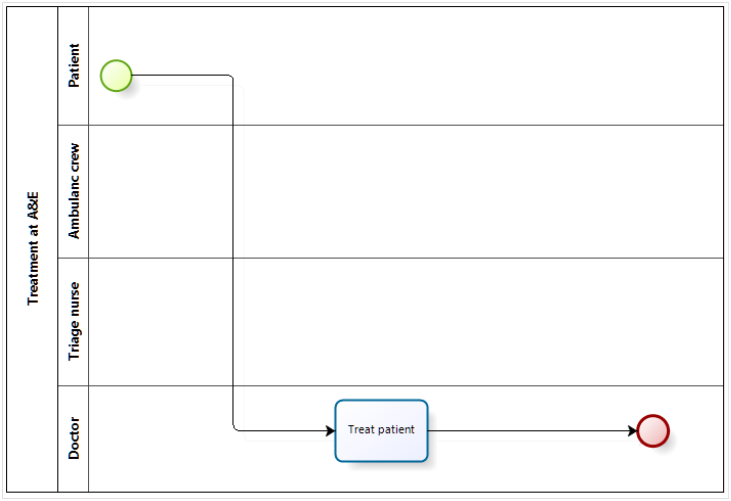
Connectors
You'll notice that the Start and Finish events above are joined by a line with an arrow. This is a sequence flow line, and all symbols within a process map need to be joined by connectors. There are three different types of connector.Sequence flow:
The one shown above is a flow line that joins events and tasks within the process. This is the most common type and generally does not need to be labelled if it is just joining two symbols as above (where the meaning is that the work flows from the Start event to the Finish event). However when you get branching within a process, you do need to label the flow lines, e.g. one line showing the flow if something does happen and another showing the flow if something does not happen (look out for this below).Association:
An association connector is a dotted line (sometimes with an arrow). This does not show flow within the process, but how artefacts (such as documents) relate to specific tasks within a process. For example if a task involves creating a document you'd have a document artefact (called a data object) with an association connector joining the parent task with the artefact. An arrow shows flow between the artefact and task (examples of associations appear later on in this article). Associations are also used to link annotations to the task elements they are describing.Message flow:
In BPMN messages can be passed between elements in different pools, and the connector for this purpose is a dashed line with a circle at the origin and a white-filled arrowhead at the destination. For this introduction to BPMN message flow will be ignored (see part 2 for an illustration of the symbol used).Tasks
In the above paragraph I mentioned "steps" - every task will contain steps, and the trick, as noted above, is to identify how granular you need to make the tasks without going to too detailed a level (i.e. making steps into tasks). There is no hard and fast rule here: just use common sense.
A task such as the one shown here is a generic task, but you can denote task type with the addition of a symbol inside the task box. There are several types of task, but for this introduction we'll just look at the three most common.
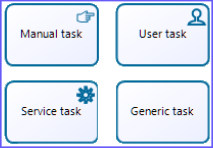 Manual task:
As its name suggests, this is a task that is carried out by a person with no help from a system. This is shown by a symbol of a hand in the top right (or left) corner of the task box.User task:
This is where a person carries out a task with the aid of a system, e.g. looking up address details or entering new data. A head and shoulders icon in the top right (or left) corner of the task box shows this.Service task:
This is where a system carries out a task without the aid of a person, e.g. calculating VAT. This denoted by a symbol of a cog wheel in the top right (or left) corner of the task box.Gateways
As noted in the section on sequence flow connectors, sometimes a process can branch with two or more options. Branching is controlled by gateway symbols (diamond shapes), the simplest of which is an exclusive gateway - there are other types of gateway, and the most useful (common) ones are described below.Exclusive gateway:
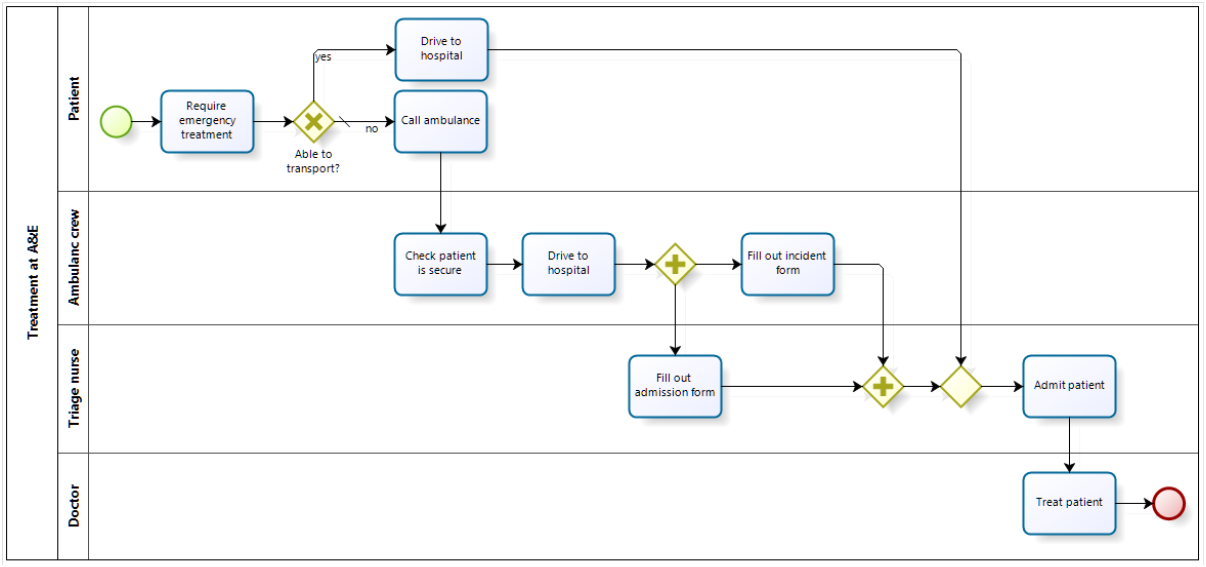
This means you can have only one of two or more options. It is denoted by an empty diamond shape, or a diamond shape with an X inside. The example illustrates a simple process with an exclusive gateway (click to expand). Note the fact that the gateway and the sequence flow arrows are all labelled to enhance understanding of the process.
Note that because this process has branches there can be more than one finish point if the branches do not join up. In this case they do join up (using the second gateway - this diamond has no X inside, but it is still an exclusive gateway), so there is only one end point.
Note also that the "no" sequence flow arrow after the first gateway has an angled line at its origin - this denotes a default action - in other words generally speaking an ambulance is called, and only rarely does the patient get themselves to hospital. If you don't know the default action, then none of the flow lines are marked as such.
We can interpret this diagram as follows:
- The patient requires treatment and is able to get themselves to hospital. They drive to hospital (or may be driven by a partner or friend: this would require another swim lane) and are admitted by the triage nurse and treated by a doctor.
- The patient requires treatment but is not able to get themselves to hospital. They call an ambulance, and the ambulance crew checks the patient is secure before driving them to hospital. They are admitted by the triage nurse and treated by a doctor.
Because an exclusive gateway is used after the task "Require emergency treatment" only one of the two options can occur, and depending on how the gateway "Able to transport?" is concluded, one or the other pathway is taken. At the next gateway, the two incoming process streams are combined. Because it's again an exclusive gateway, only one of them can pass through at a time. This seems obvious, but a parallel gateway here (see below) would require both streams to pass through so would hold up the process flow on one branch until the other was completed as well. Note that you do not need the second gateway - the sequence flows can simply go straight to the Admit patient task, but sometimes it helps to add one to make the logic easier to follow.
Parallel gateway:
Inclusive gateway:
More on gateways:
The examples above show how gateways are used to split process flow into two or more paths. As noted, they can also be used to join multiple flows. For example a parallel gateway, when used to join flows, indicates that all of the incoming flows must happen, whereas an inclusive gateway, when used to join flows, means that one or more of the incoming flows must happen (but not all of them need to). Sometimes you can omit showing the join if the logic is obvious without the need of a gateway.There are other types of gateway, but the three described here cover most situations.
Artefacts
An artefact is simply something displayed on a process map that is not part of the process flow. If you remove an artefact from a process map, you could still run the process (whereas if you remove an element like an activity or gateway, the process would fail at some point).There are three common BPMN artefacts:
Data object:
Annotations:
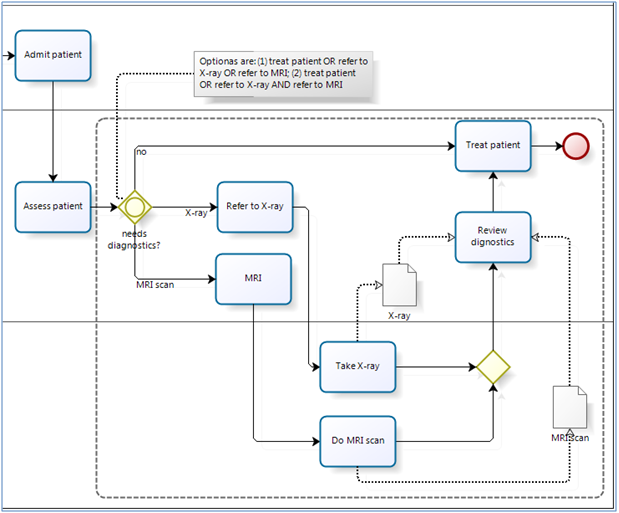
An annotation is a block of text that helps explain part of a process. You can have as many of these as you like. They do not affect the logic or flow of a process. The example here includes an annotation to explain the logic of the inclusive gateway. Be careful not to make your model too cluttered with annotations!Group boxes:
A group box is a box with dashed lines that you can use to surround a set of symbols within a process to show that they are associated in some way, without actually affecting the logic or flow of the process. The example above shows a group that collects together the activities post admission. A group is different from a sub-process (explained below), they simply group symbols and do affect process logic and low, whereas sub-process are part of the flow.Sub-processes
Processes can be very large and complex, so it can make sense to divide a process into sets of sub-processes - for example in the A&E case study the process of waiting in the ambulance until admission could be done as a sub-process. At a high level you could show the sub-processes as single task boxes, and then drill down into one or more of them to see the detail.There are two types of sub-process:
Embedded sub-process:

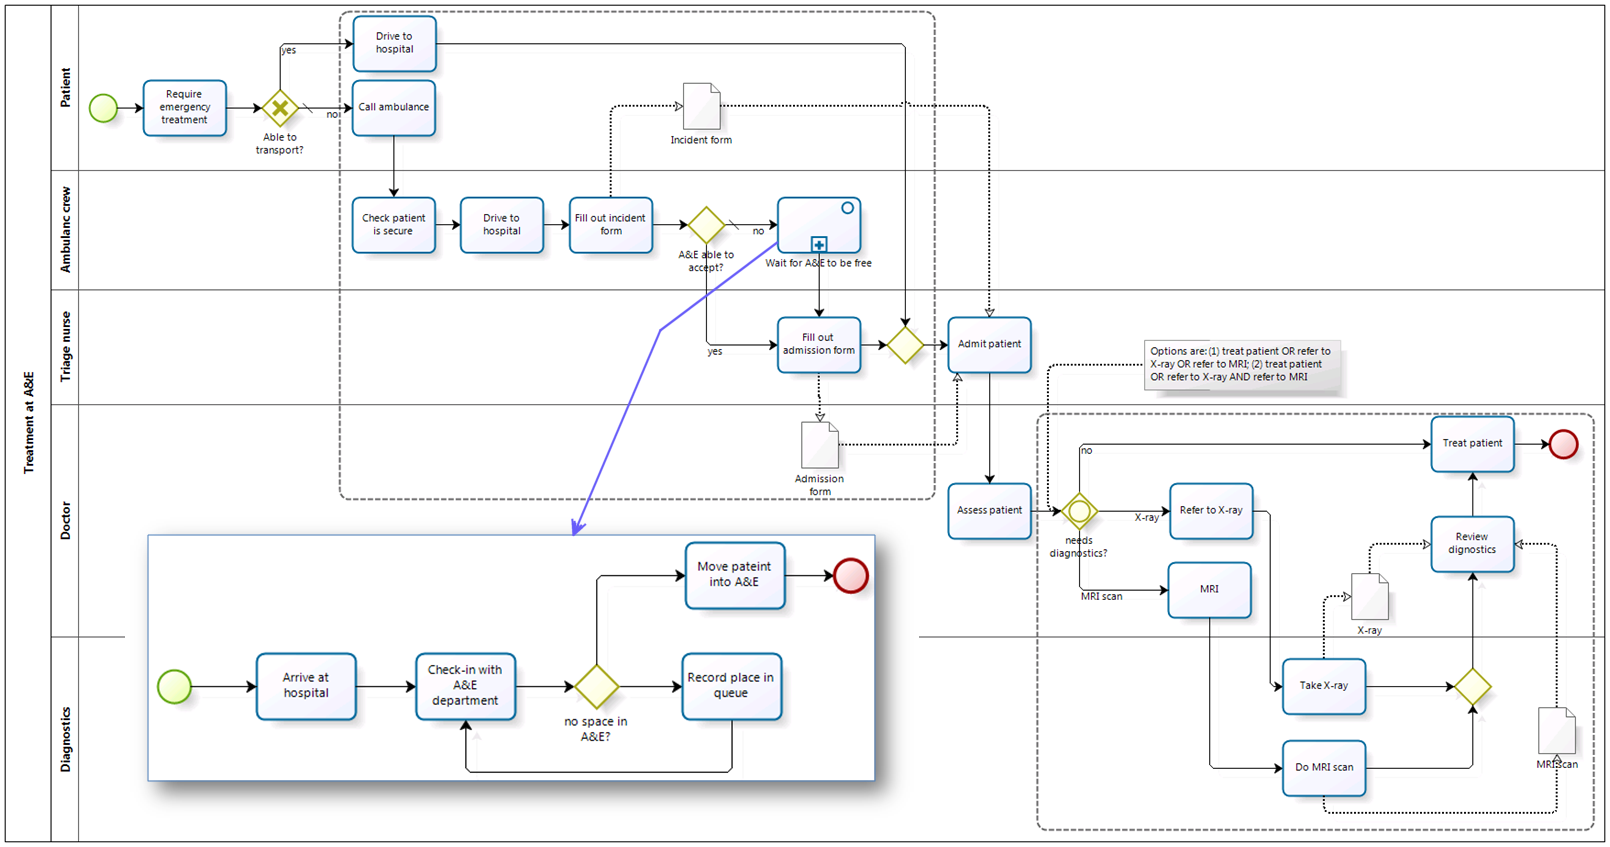
 The example above shows an embedded sub-processes in its collapsed form. This is denoted by the task symbol that has a small square with a + inside it at the bottom of the task symbol. The box with the + inside means the sub-process is collapsed so you can't see its content. The example opposite (click to expand) shows the contents of the sub-process expanded within the parent process - the box with the + has disappeared and you can now see its content.
Reusable sub-process:
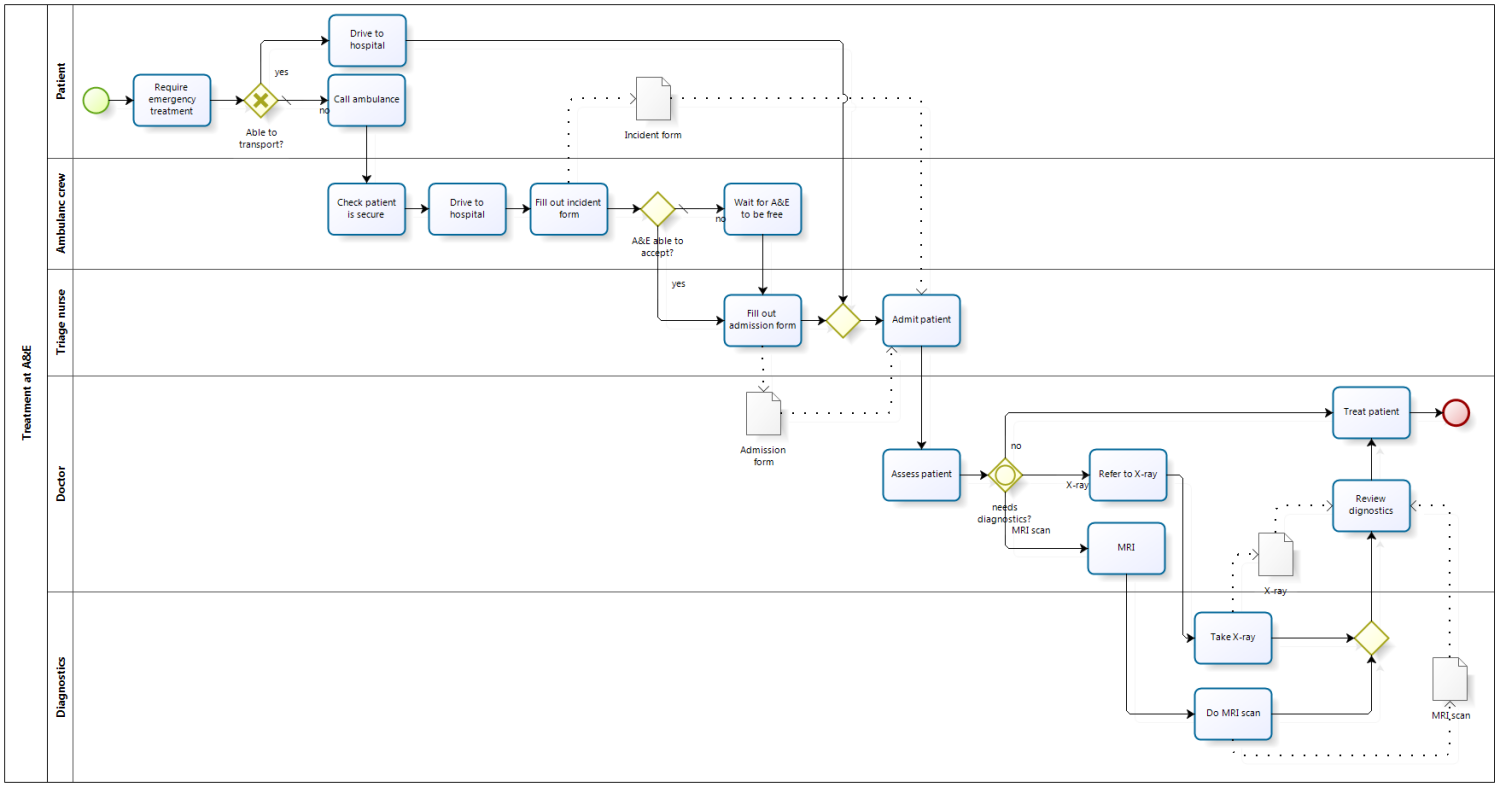
Here a sub-process can be "seen" and used not only by the process it is within, but by other processes. So if you have a generic sub-process that could be used in a number of different processes, it makes sense to make it reusable - this means you don't have to keep re-mapping it for each process that uses it. In the A&E case study, if other parts of the hospital acted in the same way in terms of ambulance admissions (e.g. maternity) then it would make sense to make it a re-usable sub-process; if it's only the A&E department, then it can be an embedded sub-process. Unlike embedded sub processes, reusable sub-processes have pools and swim lanes.The completed A&E as-is process map is shown below (click to expand). The logic of the diagram is as follows:
The process starts when a person needs emergency treatment. If they are able to drive themselves (or be driven) to the hospital, they do so and upon arrival are admitted by the triage nurse. The patient is then assessed by a doctor who sends them to X-ray and/or MRI if diagnostics are needed. If the diagnostics are needed the relevant scans are done and the doctor reviews them and then decides treatment; if the diagnostics are not needed the doctor simply decides treatment.
If the person needing treatment was unable to get to hospital, an ambulance is called. The ambulance crew secures the patient and drives to hospital, filling in an incident form upon arrival. They check to see if the patient can be admitted, and if so, they bring the patient into A&E. If not, they secure a place in the queue and continue to check / move up the queue until the patient can be admitted. Either way, once admitted the triage nurse fills in an admittance form and admits the patient. The rest of the process is as above from where the doctor takes over.
This is a relatively simple process, but it took two paragraphs of text to describe and where branching occurred it was difficult to "show" this in the description. The process map encapsulates the whole thing in a diagram.
In part 4 we will look at drawing the to-be process.
More on BPMN
This concludes the simple overview of BPMN - hopefully this gives you enough to get started. As you grow more experienced you can start to map more complex processes and learn some of the more advanced ways in which BPMN can be used. Below is list of some resources you can access to learn more (these were all last checked on 21 August 2015).- An introduction to BPMN by IBM's Ian White
- Quick reference guide to BPMN symbols (useful printed on A3)
- BizAgi video tutorials
- BPMN Wikipedia article
- Detailed article on creating BPMN diagrams
- Mapping different types of workflow pattern using BPMN
- The official full specification of BPMN version 2.0 (not light reading)
- The home of BPMN
Great article! I have also found BPMN Symbols Explained using Lucidchart and their site is very straightforward and easy to use! Check it out!
ReplyDelete