An activity network is a diagram that shows the sequence in which tasks will take place and their inter-dependencies. It is therefore the basis of project planning, and it is impossible to create a full Gantt Chart without having undertaken activity network planning in some form. Quite literally it is the key tool that helps you to understand what you have to do to deliver the project.

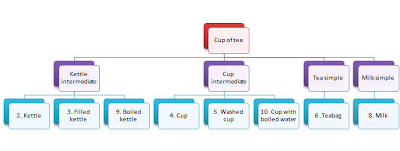
In this post we’ll be following up on the cup of tea PBS from the last article, so here is the relevant PBS with numbers added to cross reference to the activity networks below (click to enlarge).
What is an Activity Network?
As noted above, it’s a diagram that shows activities and their dependencies. They are also known as Network diagrams, and Activity-on-Arrow diagrams. Below is an activity network for the “project” to make a cup of tea.In this diagram (click to enlarge) 2 cannot exist until the linking activity between 1 and 2 has taken place, and similarly 3 can’t happen until the link from 2 has taken place. After this 9 and 4 are both dependent on 3, but 9 is also dependent on the chain that runs from 4 to 8. The numbered circles represent intermediate products and the arrows are the tasks that need to happen between each product. The labels make it easier to understand the diagram.
The network shows the order in which tasks must happen and also where things can happen in parallel – for example the sequence of tasks that link 4 to 8 can happen in parallel with boiling the water.
The activity network only shows sequence, it doesn’t show duration. For example the activity of boiling a kettle (link from 3 to 9) is likely to take longer than the chain that runs from 4 to 8.
If you have completed a PBS prior to creating the activity network, the circles can be numbered using the PBS labels. However you often find that the PBS has missed some intermediate products. For example the tea PBS from the last article has only eight products. The missing products are 1, 7 and 11. 7 could be labelled “Cup with teabag”, and 11 as “Brewed tea”. Since all activities need to start from a point where nothing has yet happened, the “product” 1 is added as a start point.
In some cases this means the PBS needs to be updated as genuine products that weren’t identified before are brought to light. In other cases it isn’t necessary as the “new” products are often combinations of components (e.g. 7).
Creating the activity network can be done in a workshop with relevant members of the project team, but often the project manager can work from the PBS (or WBS). If you have created a PBS, you can transfer the product names to sticky notes and then arrange them on a wall in the sequence that they need to happen. Sticky notes can be moved around, so if you don’t get it right first time it’s easy to make changes.
For very large projects it may not be practical to do this, and you may wish to use a tool like MS Project. In this case, you can enter the items in the Gantt chart view in the approximate order that they will occur and then switch to the network diagram view to create the links between the items. This view can be zoomed in and out so that you can work on segments of the network in detail and zoom out to look at the whole. It may be worth turning off automatic layout because otherwise connecting lines can sometimes be obscured.
The first screenshot here (click to enlarge) shows the items entered into the Gantt chart view, and the second (click to enlarge) shows how these appear in the Network diagram view. Note that it’s the activities rather than the products that are shown in MS Project as the Gantt chart shows tasks and durations. Thus the network diagram in MS Project has activities in the boxes rather than products.
|
| ||||
|
|
Durations
Once the tasks and dependencies have been established and drawn up, the next step is to add task durations. This allows you to calculate how long the entire project will take. You proceed by:- Adding the duration of each activity
- Putting the cumulative time so far in each circle
- Where a circle (or node) has two or more arrows pointing to it, you take the largest time value and ignore the lower values (this represents the critical path)
The diagram below illustrates this for the tea example.
Node 3 has a cumulative total of 15 seconds and it takes 3 minutes (180 seconds) to boil the kettle so node 9 has a cumulative total of 195 seconds. This is because the time for the tasks on the parallel activity (wash cup, etc) is less than the three minutes to boil the kettle – so in spite of there being more activities on that path, the critical path is via the boil kettle activity.
The activities on the parallel path take 48 seconds, giving 180-48=132 seconds of “slack” time – this means there could be up to 132 seconds of delay in that set of activities without affecting the overall project timeline. In project management terms this is called float.
 |
| Screenshot 5 |
 |
| Screenshot 6 |
Coming next: Resources and levelling


No comments:
Post a Comment